01 The verdict
Four numbers that summarise 8.6 years and 27,564 earnings events.
LONG EPS beats ≥10% outpace the universe baseline 60 trading days out — p = 0.0001 (n = 11,858) on the broad Russell 2000. Magnitude is monotonic: the bigger the beat, the stronger the drift.
Filtering on announcement-day price direction adds nothing and actively loses money in the realistic portfolio model at every holding period (30–90d).
US large-caps and ASX large-caps are efficiently priced. Big compounded $ on large caps is leveraged beta, not drift.
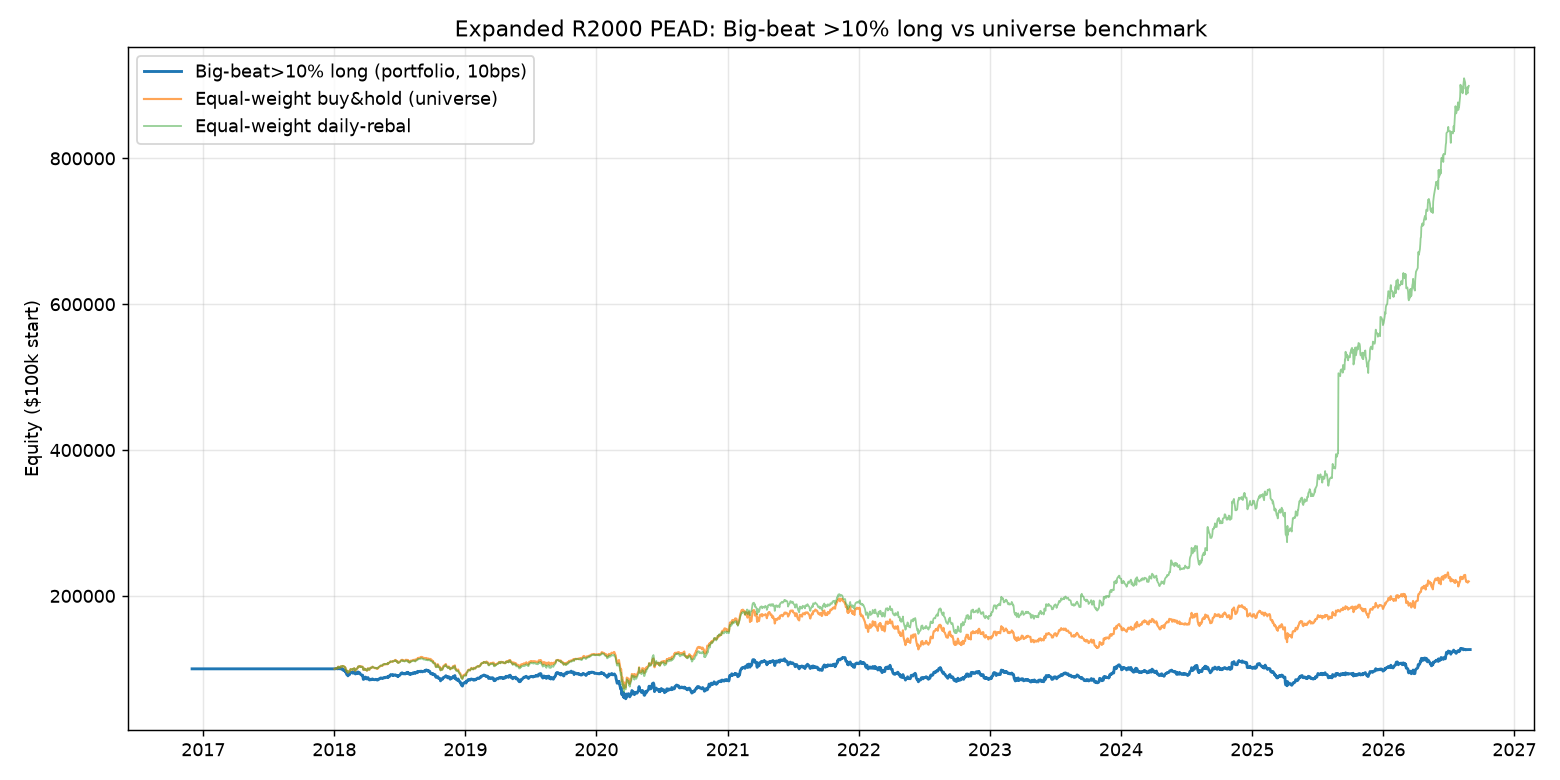
The edge survives ~20 bps round-trip costs, dies at 50 bps. Realistic portfolio returns (+26% to +71%) underperform equal-weight buy & hold (+799%).
02 Strategy & methodology
Event-driven backtest, strict point-in-time handling, no lookahead. Reaction window uses only prices known before entry; entry at the open of the session after the full reaction; exit at the close of the 60th trading day.
| Component | Definition |
|---|---|
| Concordant signal | LONG: beat consensus and announcement-day return > 0 · SHORT: miss and return < 0 |
| Magnitude signal | Surprise buckets: 0–2% / 2–5% / 5–10% / >10% of consensus EPS |
| Timing | BMO/AMC recovered from announcement timestamp (≤12:00 → BMO, ~16:00 → AMC) |
| Entry / exit | Open of session after full reaction · close of 60th trading day (Bernard & Thomas) |
| Execution models | Fixed-fraction (10% of initial, no compounding) + concurrent portfolio with daily MTM and 100% gross-exposure cap |
| Costs | 0 / 10 / 20 / 50 bps round-trip sensitivity |
| Beta control | Every result is a differential vs equal-weight buy-and-hold benchmark of the same universe, with Welch t-tests |
03 Universes & data
Three curated universes first, then a survivorship-bias-free expansion to the full point-in-time Russell 2000.
| Universe | Names | Events | Consensus source | Notes |
|---|---|---|---|---|
| US large-cap | 45 | 1,524 | Yahoo analyst estimates | Mega-caps: no edge |
| US small/mid-cap | 37 | 1,231 | Yahoo analyst estimates | Where the edge first appeared (p=0.002) |
| ASX large-cap | 13 | 173 | Time-series YoY EPS from PDFs | No free keyless ASX consensus |
| Russell 2000 (2016 PIT) | 909 | 26,674 | Yahoo analyst estimates | 1,909 listed; 862 delisted since → bias killed |
04 Results — the edge analysis
60-trading-day forward returns vs universe baseline, gross.
US small/mid caps (37 names) — where the edge first appeared
| Signal | n | Avg 60d fwd | Diff vs baseline (+4.72%) | p | Verdict |
|---|---|---|---|---|---|
| beat >10% (LONG) | 462 | +8.12% | +3.40pp | 0.0021 | The edge |
| beat 5–10% | 191 | +5.08% | +0.37pp | n.s. | not significant |
| beat 2–5% | 164 | +1.02% | −3.70pp | n.s. | not significant |
| beat 0–2% | 72 | +1.95% | −2.77pp | n.s. | not significant |
| beat_up (concordant) | 503 | +4.90% | +0.18pp | 0.84 | dead — no value |
| miss_down (concordant short) | 188 | +1.54% | −3.18pp | 0.035 | sig differential, poor $ |
US large caps (45) & ASX (13)
| Universe | Baseline /60d | beat_up diff | beat >10% diff | Verdict |
|---|---|---|---|---|
| US large | +4.21% | +0.05pp (p=0.93) | +1.38pp (p=0.073) | No exploitable edge |
| ASX large | +0.84pp beats | n.s. | — | No PEAD edge; all variants < buy & hold (+104%) |
05 The Russell 2000 expansion — does it survive at scale?
909 tickers, 26,674 events, survivorship-bias-free. Realistic concurrent-portfolio model (100% gross cap, daily MTM, 10bps).
Surprise magnitude is monotonic
Avg 60d forward return by EPS-surprise bucket (beats only, broad R2000).
Concordant filter destroys value
Portfolio-model total return by holding period: beat>10% long vs base_concordant (incl. shorts).
Portfolio economics by holding period (100% gross cap, 10bps, ≥$2M ADV)
| Hold | beat>10% long | PF | base_concordant | PF |
|---|---|---|---|---|
| 30d | +39.2% | 1.08 | −44.7% | 0.85 |
| 45d | +42.6% | 1.11 | −4.0% | 0.96 |
| 60d | +26.4% | 1.08 | −11.7% | 0.92 |
| 90d | +70.5% | 1.29 | −23.0% | 0.90 |
Liquidity filter sweep (60d hold, beat>10%, 10bps)
| Min ADV | Events | Portfolio total | PF |
|---|---|---|---|
| none | 26,560 | +71.6% | 1.23 |
| $2M | 22,113 | +26.4% | 1.08 |
| $10M | 13,238 | −8.7% | 0.94 |
| $50M | 3,247 | +67.5% | 1.17 |
Cost sensitivity — the edge's real capacity
Profit factor vs round-trip cost (60d, ≥$2M ADV). Survives ~20bps, dies at 50bps.
Edge differentials vs baseline
60d forward-return differential by signal group (broad R2000, baseline +3.14%).
06 Key findings
- The concordant filter adds no value — and on small caps it hurts. Beats that fell on announcement day had higher forward returns than beats that rose (mean-reversion on the reaction day).
- The real edge is surprise magnitude: LONG EPS beats ≥10% → +3.40pp/60d (p=0.002) on curated small caps, confirmed at +0.97pp/60d (p=0.0001) on the full Russell 2000. The classic Bernard–Thomas / Livnat–Mendenhall effect.
- Mega-caps (US + ASX) are efficiently priced — no edge, just leveraged beta.
- Shorting miss+down has a significant differential (−3.18pp, p=0.035) but poor absolute economics — a hedge, not a standalone book.
- Costs are the binding constraint: the edge survives ~20bps round-trip and dies at 50bps. Only low-cost vehicles can express it.
- Best config found: 90d hold, ≥$2M ADV, >10% beat, long-only → +70.5%, PF 1.29 over 8.6 years.
- Don't trade the transcript's concordant rule as-is. It systematically loses in the realistic portfolio model at every holding period.
07 Reproduce it
Everything is free-data and keyless. Full pipeline, engine and results live in the pead_strategy/ workspace.
src/backtest_engine.py (engine), src/build_r2000_data.py (data), src/run_r2000.py (edge analysis + sweeps), results/us_r2000_results.json (full JSON), results/trades_r2000_bigbeat_portfolio.csv (trade-by-trade). Full narrative: Research/StrategyBacktests/pead-post-earnings-announcement-drift.md in the companion vault.